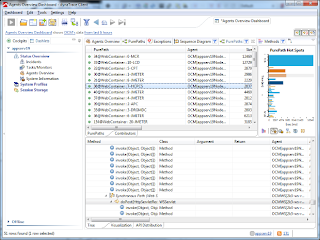
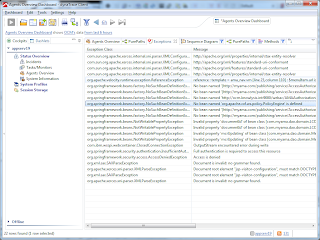
Download the dynatrace full install for linux x86 and windows x86 here product download page
Obtain a license key for evaluation (file will have a name like dynaTrace_license_201107201015.key)
You must have a dynatrace account to download them (dynatrace-3.5.2.2393.msi, dynatrace-3.5.2.2393-linux-x86.jar, dynaTrace_license_201107201015.key)
page dedicated to installation
Define a dedicated VM for dynatrace server/collector, I put the full install jar on a RedHat VM which acted as my server (make sure it has 4GB of RAM)
Run this to install the jar:
java -jar dynatrace-3.5.2.2393-linux-x86.jar
With this extracted to a folder (I put it in ~\dynatrace..) you can start the dyna collector and server with these commands:
cd dynatrace
nohup ./dtserver &
nohup ./dtanalysisserver &
nohup ./dtcollector &
I then ran the install for dynatrace-3.5.2.2393.msi on my desktop, I only installed the dynatrace client on my desktop.
Now you need to copy the dynatrace/agent/lib folder to the servers you want to profile/monitor (do not copy the folder to a path with a space in it like "program files", I put them in c:\tools\dynatrace\agent\lib)
Now you can change the websphere application server JVM arguments to add the dynatrace agent :
-agentpath:"C:\Tools\dynaTrace\dynaTrace 3.5.2\agent\lib\dtagent.dll"=name=OCMWS,server=192.168.1.122
-agentpath:/root/dynatrace-3.5.2/agent/lib/libdtagent.so=name=OCM,server=192.168.1.122
Note: Edit the line above to match the path to where you copied the dynatrace agent dll/so, also give each JVM you are monitoring a different name, and finaly the IP address is the dynatrace server IP address which may be different for you.
To add this to the JVM startup on WebSphere open the IBM console and go to
Servers | application server | server1 | Java Process and Management | Process Definition | Java Virtual Machine | Generic JVM Arguments
prepent the full -agentpath value to the Generic JVM arguments
Click ok and Save your changes, double check that the save took place by entering the console again and checking the generic jvm argument for the new value.
You will have to restart WebSphere to have the JVM startup with the new startup JVM arguments.
Launch the dynaTrace client after doing the above, tools | settings | dynatrace server | connectivity | put in the host IP address.
default values for login are admin:admin, port 2021, test the connection, it should be a green arrow and say success.
Click License, attach the license .key file for dynatrace evaluation: dynaTrace_license_201107201015.key.
Use online videos to see how to use the client to slice and dice the data from the agents and profile your application.


There is no license for the client so you can export captured data and give it to anyone with the client installed and they can view the details of the session and use the client to troubleshoot and make changes.

No comments:
Post a Comment